The last week has been an interesting one with lots of good conversation about measuring, data and theory here and on Twitter. I think three themes have emerged. Hoping to get additional thoughts, input and dissenting views 🙂
Theory vs. Data. I remember a good discussion at LAK11 between David Wiley and Eric Duval (I think) about the data tail wagging the theory dog… or wait should it be the data dog and the theory tail… It was an excellent discussion and should have been the start of something with great potential. Fast forward to 2015 when I emerged from the deep depths of corporate learning and that debate seems to have disappeared with the data/ analytics folks having gone off in one direction and the learning folks having gone in another. Does anyone else find it alarming that we appear to be leaving the development of learning systems to computer and data scientists who know virtually nothing about learning theory & practice? Shouldn’t we be using data to challenge our theory and theory to explain our data?
Example: The best advice my old boss gave me in pitching a new scenario-based approach to learning was to “park my learning theory.” So we gave them just enough theory to convince that what we were offering was not snake oil and then explained in simple terms how our proposal should move their numbers. We committed to targets that we if the theory worked, we could meet. Yes, our approach was based on the 4C-ID instructional design model and constructivist learning theory, but it was best we kept that to ourselves. When we outperformed even our expectations and the learning team of our first large client tried to shut us down, it was the numbers and data that saved our project.
When we showed the numbers from the first client to the second large client, again it was speaking numbers to the operations folks that allowed us to continue on. When we couldn’t make any headway with the learning or operational folks talking theory, the numbers moved mountains.
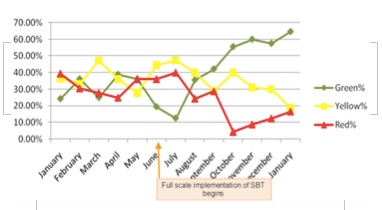
 This slide shows the program performance improvements as the new training was implemented globally. It shows the percentage of “metrics that matter” that were meeting target (green), approaching target (yellow), and not meeting (red).
Why it worked. I had a great team that understood/ learned and believed that using different learning theories could actually improve learning outcomes. They cared about improving learner performance. They saw and cared about the people who would not have a job if our training did not succeed. Most of them had started as agents and understood the stress and challenge our learners faced and also the benefits that could come with succeeding. We also knew what metrics we needed to move and could set clear measures of success which enabled us to gain the support of operational partners who really did not understand, or care to understand, learning theory. So we figured out how to use those metrics to drive the change and help the folks who most needed help and support.
Imbalances in Power. Many of the conversations in which we started talking about measures, we wound up talking about imbalances in power: when one party is using rolled up numbers to defend a claim where the other party is has no access to the data to defend. Clearly this makes for an unfair fight, but why does the default answer to this problem seem to be to stop using data on either side? Doesn’t it make more sense to push for open, common data from which both sides can build a case?
Example: New line of business (LOB) launched and customers were not happy. Ops manager relied on previous experience and assumed we had a technical skill problem. His answer? Increase required tech knowledge for new incoming agents. I argued that based on the data it looked to be a problem related to poor issue identification which could be solved with job aids and training. Being the odd women out, halfway around the world from the actual problem, new to the tech vertical and the learning and quality rep, my opinion would never fly unless and until, I could get someone to utter the magic words, “Let’s look at what the data says…” With those words came hope.
Why it worked: Open data, open models. We used a data sources that, once wrestled from the control of the analytics team were open (in the most closed sense of the word) for analysis. I could complete and analysis and walk them through it and the Ops manager could replicate my analysis and try to poke holes in it. If they weren’t wholly convinced, they could sometimes be convinced to do an A/B trial of one of my “crazy” ideas, especially when they were desperate. We also used the simplest possible tools (ever see a billion dollar company run using Excel?) Yes, we used complex client tools, but if we wanted to use the data, we exported granular agent or transaction level data to Excel and then rolled it up. As a result, it could always be unrolled and the data transformations could most often be found in the formula bar.
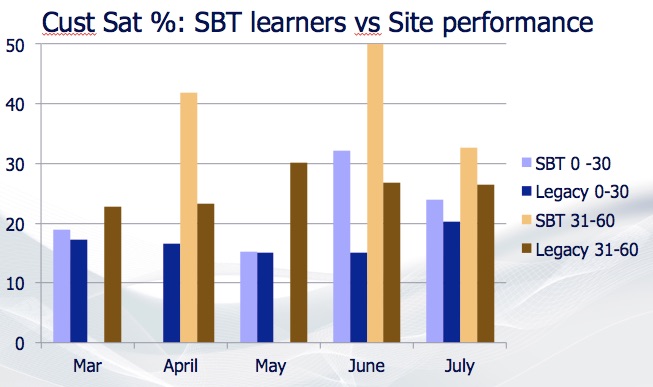 This image shows the performance of “our” learners vs. those who went through the “legacy” training. In this case we consistently outperformed which made it easier to gain support to use this approach with more learners. Because we agreed on what data we were using and had open(ish) data I could transcend what would have otherwise been an insurmountable power imbalance.
Qualitative vs. Quantitative Measurements. I think I’ve also realized that much of the objection to measuring and data is the desire to simply count – count clicks, count students, count number of hours spent, count number of courses produced. Clearly only counting units will lose the qualitative aspects and can trigger a race to the bottom in terms of quality. So why aren’t we looking to build metrics that seek to build in qualitative aspects and measure value?
Example: In almost all LOBs I supported, there was a series of metrics that had only in combination were aligned with success. These metrics usually included count measures: call volume (# of calls), service level (# of calls dropped), costs (# of dollars spent) and a rating or quality metric: a customer satisfaction or willingness to recommend (perception of customer), quality score (perception of quality team).
Why it worked: I have realized this week that the customer contact industry has is quite mature in terms of metrics. In most cases, the importance of the rating or quality metrics outweighed the count metrics. These metrics were also not treated as something static, but were revised based on findings, assumptions and theories. As a result, in the short-term you could “game” a metric, but only good, theory-based performance could withstand changing metrics without seeing drops in the numbers. Interestingly, it seems to take as much or more effort to “game” a relatively good metric than to achieve it honestly, and given the choice (and skills for success) most folks will choose to get there honestly.